ADIM — AI-DRIVEN INFRASTRUCTURE MONITORING
One Step Ahead in Operations
Traditional monitoring stops at generating alerts — AI-driven infrastructure monitoring shouldn’t. ADIM analyzes alerts with AI, remediates safe ones through pre-approved runbooks, escalates risky ones to humans — and records every action in a full audit trail. In Turkish, ‘adım’ means ‘step’ — and that’s exactly what ADIM keeps you: one step ahead.
Does the 3:00 AM alert sound familiar?
Alert noise
Hundreds of alerts, only a handful of real incidents. Your team wastes time separating signal from noise.
Repetitive interventions
Disk full → clean up. Service down → restart. The same manual fixes, repeated week after week.
After-hours burden
Waking up at night for a simple service restart burns out the team and delays the response.
How AI-Driven Infrastructure Monitoring Works in ADIM
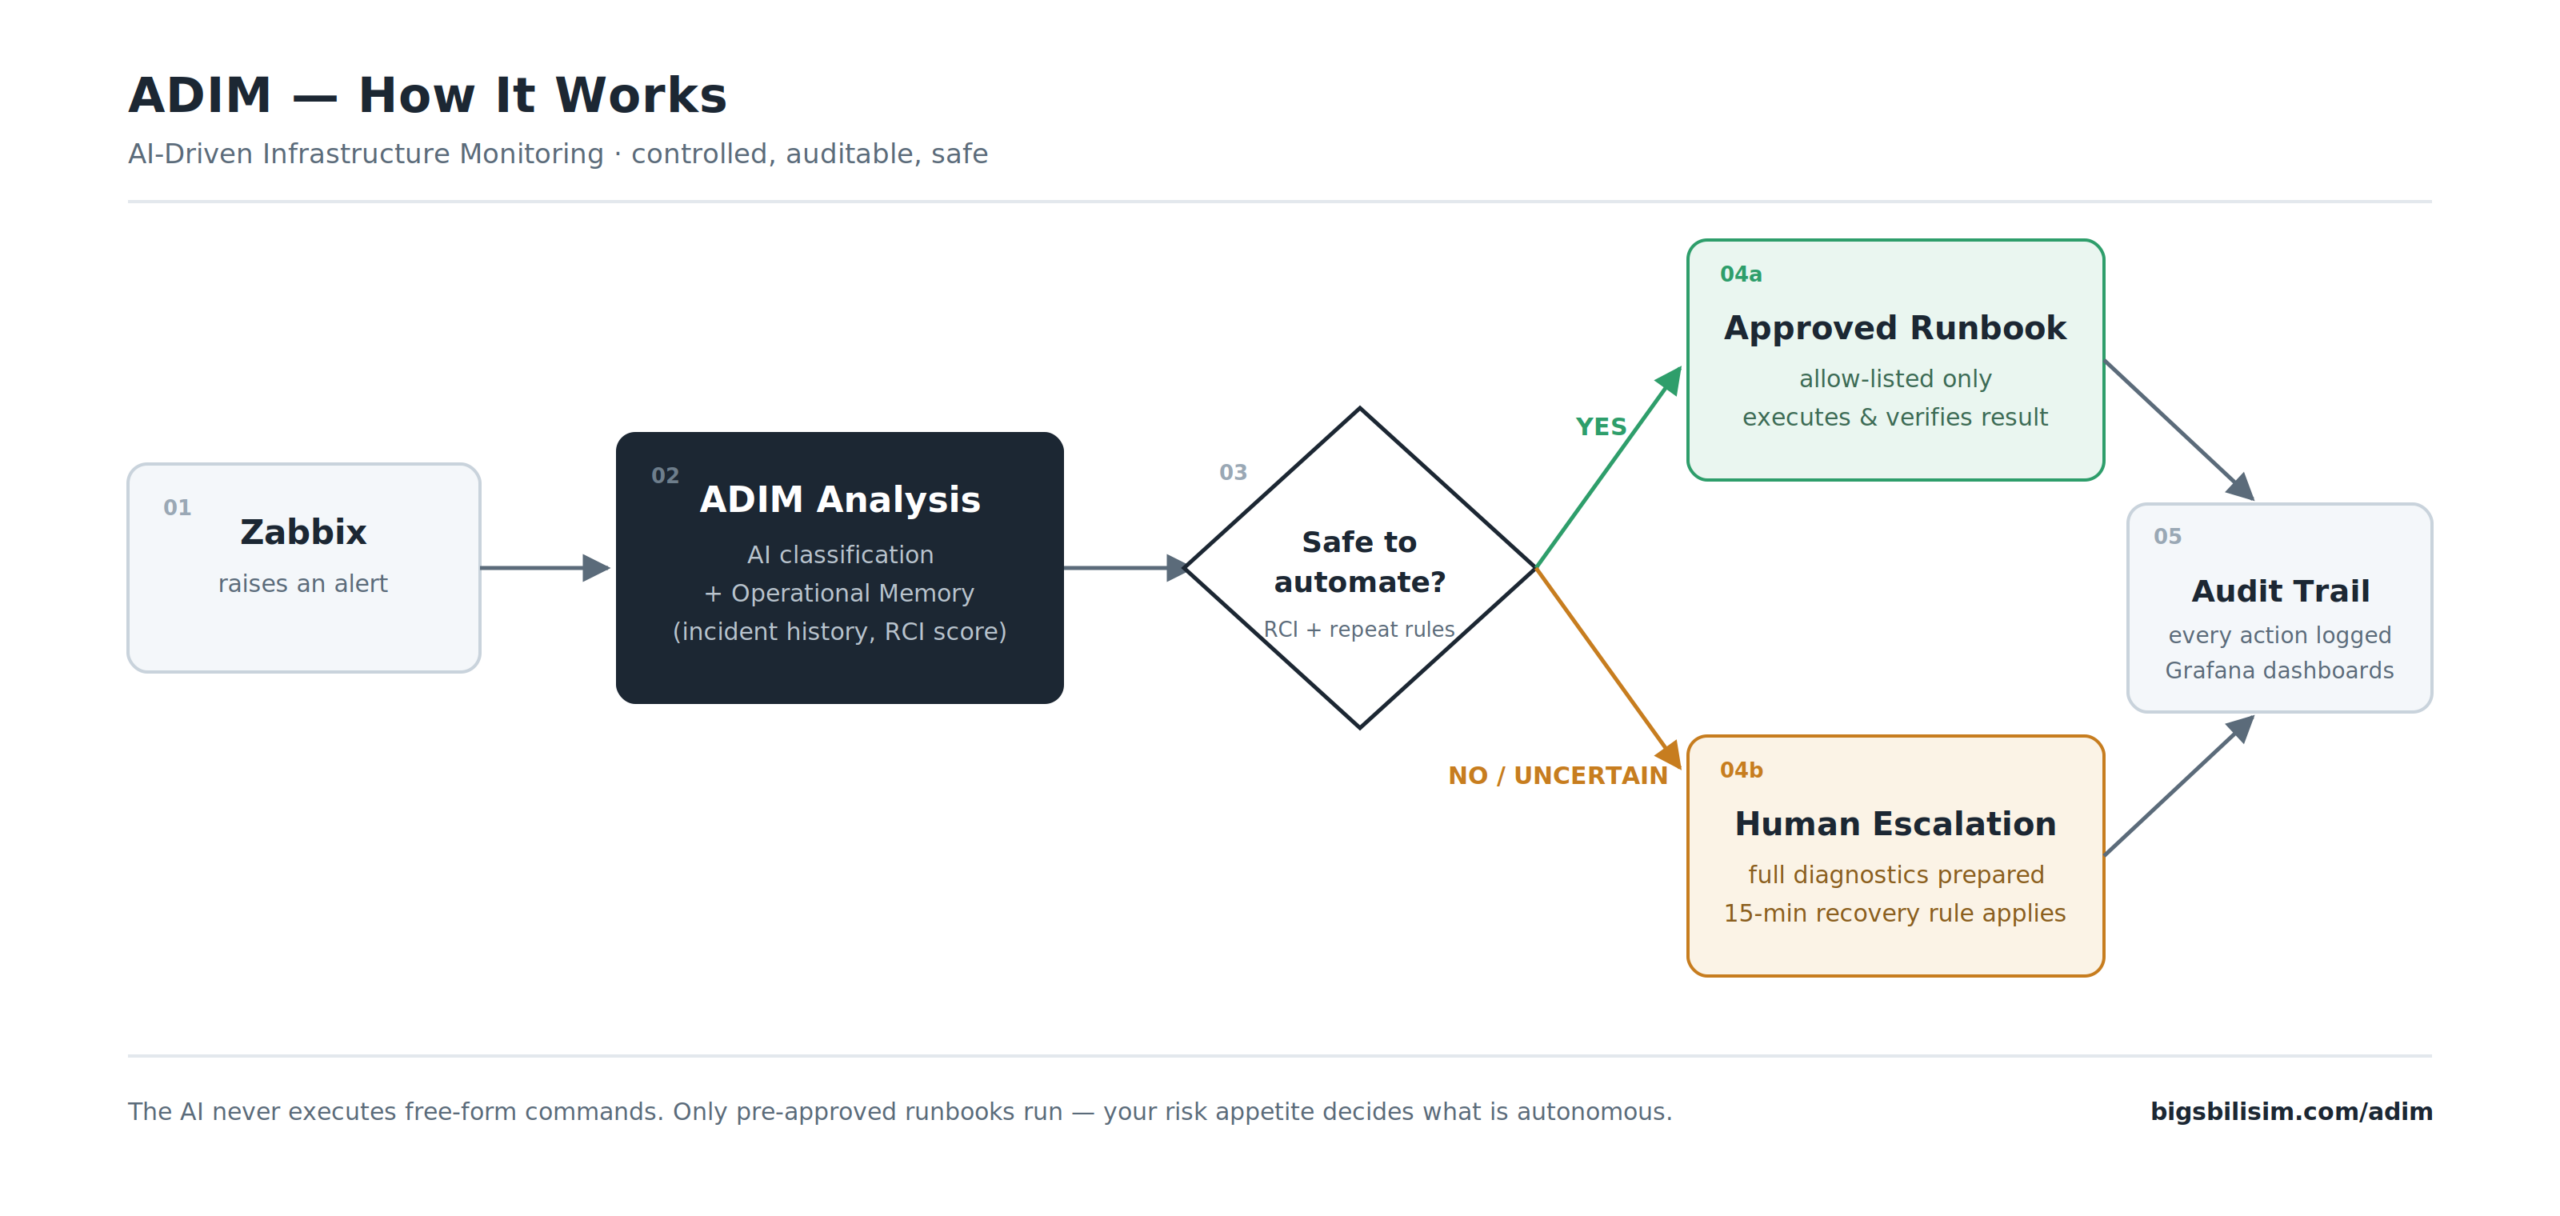
Zabbix raises an alert → ADIM analyzes it (AI classification + operational memory of past incidents) → Is it safe? → Yes: an approved runbook executes and the result is verified → No or uncertain: escalation to a human, with full diagnostics already prepared.
In ADIM, the AI never executes free-form commands. Only pre-approved, allow-listed runbooks run. If the same alert has repeated three times within six hours, automated remediation stops and the incident is handed to a human. Any incident that doesn’t stabilize within 15 minutes exits auto-remediation mode and transitions to human ownership.
Every remediation runs in one of three recorded modes: automatic (the runbook passed every RCI gate), approved (a named operator approved it from chat), or suppressed (correlated as a symptom or duplicate — acknowledged, no action). The approver, the evidence and the result are stored with the incident. ADIM covers Linux, Windows and Docker hosts, VMware vSphere, and — read-only — SNMP-monitored network devices.
Don’t trust automation blindly. Measure it.
RCI — Runbook Confidence Index
Every runbook is scored on predictability, reversibility, blast radius, historical success rate, and detection confidence. The result is one of four levels: Autonomous, AI Recommended, Approval Required, Manual Only. Your risk appetite — not an algorithm — decides what runs automatically.
Operational Memory
Every incident is recorded together with its outcome and root cause. When a new alert arrives, ADIM already knows the answer to: has this happened before, and what actually worked?
Full audit trail
Every action — successful, failed, skipped, or manually escalated — is reported. Designed for enterprise environments with audit and compliance requirements.
What ADIM covers today
Linux, Windows and Docker remediation
Disk clean-up, service and container restarts, monitoring-gap checks. Containers you mark as protected — databases, the monitoring stack itself — restart only after approval. Alerts that follow a planned change (an OS update, an unattended upgrade, a change you reported from chat) are recognised from the change log and closed with the evidence attached, instead of waking someone up.
VMware vSphere: correlate, collect evidence, act only with approval
A VM alert while its hypervisor is down is a symptom, not an incident; the same datastore alert from three hosts is one incident, not three. ADIM correlates first, collects vSphere evidence, classifies the case and proposes the corrective action — power a VM back on, reconnect a host, remove old snapshots — which runs only after a named approval and is verified afterwards. Everything else is escalated with L2 advice attached.
OS update automation
Maintenance windows per host, a notice and approval 24 hours ahead, serial execution, pre-checks, post-reboot checks and an independent audit the next morning. A dry run shows exactly what would happen. If a post-check fails, the maintenance is closed early and the normal runbooks take over.
Network devices — read-only by design
For SNMP-monitored switches and routers ADIM correlates (a device that stopped answering vs. its interfaces), collects read-only evidence — admin/oper status, errdisable, optical levels, error counters, logs, config diff, the far end — and notifies the right people with the evidence in hand. It takes no action on network devices, not even with approval: production traffic is not something a runbook should touch. Daily configuration snapshots are kept. Validated on a simulated Cisco IOS lab; vendor-specific validation is part of the pilot.
Maintenance control from chat
“Put the DB host in maintenance until 18:00.” “Monitoring off for host X tomorrow 09:00–16:00.” Natural language, immediate, reversible, logged. ADIM watches the host and tells you when it is back.
Capacity: disk trends and CPU/RAM right-sizing
Daily disk-fullness forecasts and a monthly CPU/RAM right-sizing report (30-day window, business hours weighted), built on Zabbix data and enriched with vSphere data where available. Deterministic rules — no AI guesswork in capacity numbers.
Actions History — the incident dossier
A web UI where every alert becomes a dossier: the timeline of each step ADIM took, the evidence it collected, who approved what and when, similar past incidents, and an AI narrative in English, German or Turkish. Role-based users (admin / operator / viewer), 18 months live retention with archive, Markdown export and a JSON API — so your auditor and your customers read the same record you do.
Dashboards, reports and self-improvement
Six Grafana dashboards, including Runbook Outcomes, Alert Flow & Noise, AI Decision Quality, Host Health and Human in the Loop; a daily shift-handover report; and a weekly noise review that lists which manual actions have become automation candidates. When ADIM finds a gap in its own coverage it files an improvement item for a person to review — it never modifies itself in production.
Runs on your servers, connects to your Zabbix
ADIM is installed as Docker containers (workflow engine + PostgreSQL/pgvector) on a server in your environment by a scripted installer that ends with a 19-point verification. It connects to your existing Zabbix (6.0 or newer) — it does not replace it. Only the alert webhook endpoint is published, over HTTPS with an IP allowlist; the management UI is never exposed. Alerts, incident history, evidence, runbook outputs and the audit trail are stored on your server.
Three things do cross your perimeter, and we say so: the AI model calls (a cloud LLM API by default, or a private on-premise LLM for isolated environments), the license heartbeat, and the notification channels you choose. Exactly what each one carries is documented on the Security & Data Flow page.
Security & Data Flow: what runs where, what leaves your network, and the guardrails →
Who is ADIM for?
- Enterprise IT operations teams — who want to cut alert noise and automate the L1 workload
- MSPs and outsourcing providers — who need a consistent, auditable remediation standard across multiple customers
- Regulated industries — who must keep a who/what/when record of every action
Setup + monthly managed service
After a one-time discovery and pilot deployment, ADIM operates AI-driven infrastructure monitoring as a monthly managed service: runbook development, integrations, dashboards, monthly reporting, and continuous tuning are all included. Pricing is based on the number of monitored systems and the runbook scope.
ADIM is built by Bigs Bilişim — a team with 26 years of enterprise systems experience, delivering SAP Basis, Windows/Linux, and monitoring operations services to enterprise customers including Daimler Truck AG. About Bigs Bilişim →
Frequently Asked Questions
Can the AI execute a wrong command?
No. The AI only performs classification and decision support; everything that executes is a pre-approved, allow-listed runbook. Free-form command generation is blocked at the architecture level.
Where does the AI run, and what does it see?
By default the classification and diagnosis calls go to a cloud LLM API over HTTPS. The model receives the alert text, the host name, the trigger, operating context (OS, recent changes, maintenance state) and short evidence excerpts from the runbooks — never credentials, keys or configuration files. Customers who cannot allow this run ADIM with a private LLM on their own hardware. The full list is on the Security & Data Flow page.
What happens if we end the service?
ADIM runs under a signed license lease that your installation renews every six hours. When the lease is no longer renewed, automation stops and alerts are forwarded as raw notifications — monitoring itself continues, and all data, runbooks and history stay on your server. Your Zabbix was always yours.
Does it work with monitoring tools other than Zabbix?
The current version is deeply integrated with Zabbix. Integration with other monitoring tools that can emit webhooks is evaluated as part of the project scope.
How long does deployment take?
A typical pilot — discovery, deployment, and the initial runbook set — goes live within 2–4 weeks.
Does it work behind a proxy or in an air-gapped environment?
Behind a proxy: yes, out of the box. Fully air-gapped: on request — it requires the private LLM option (inference on your hardware) and an offline license lease instead of the heartbeat. Talk to us before assuming either way.