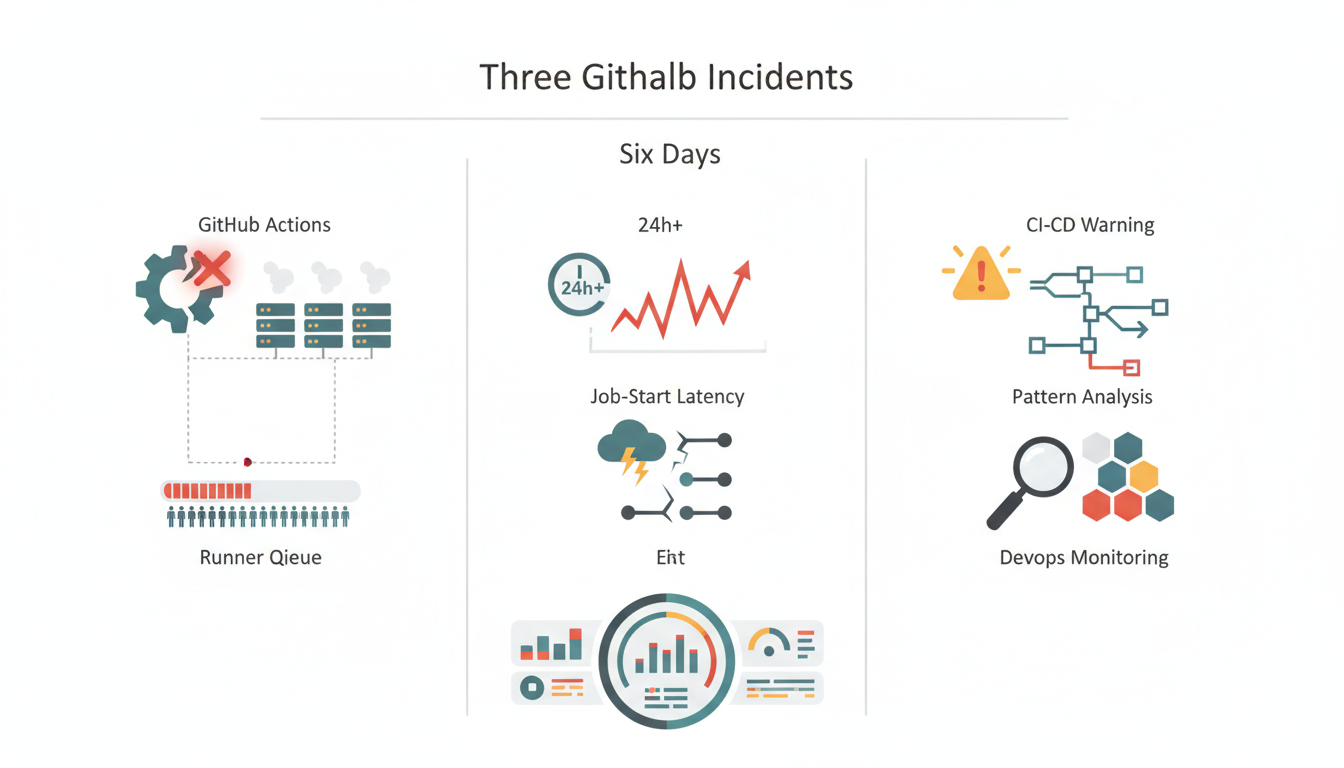
At 16:52 UTC on October 7, 2026, write operations across GitHub failed for the second time that day. Actions, Git Operations, Issues and Pull Requests were affected until 17:01 UTC. The first mitigation had bought some time; it had not removed the condition.
The recurrence lasted nine minutes. That sounds small when written in an incident timeline. It feels rather less small when a deployment is waiting for a push, a check or a workflow to move.
Five incident URLs were proposed for this story, but only three incident texts were included in the supplied source material. I will not manufacture the missing two. The three available reports still give us a useful sequence: a repeated write outage on October 7, a database-capacity incident on October 12 and delayed workflow logs on October 13.
The signal was spread across different symptoms
The common component in all three supplied reports was Actions. That does not prove one shared root cause. GitHub explicitly linked the two October 7 outages to the same root cause, while the later reports describe different failures.
What interests me is the operational shape. Writes failed twice on October 7. On October 12, users could have trouble queueing new Actions runs and interacting with the Checks API. On October 13, workflows ran normally, but their logs appeared late.
Those are different layers of a CI/CD service. One accepts or records work. Another places work into execution. Another exposes the evidence that the work is progressing. If we watch only the final workflow result, these layers collapse into one vague complaint: “CI is slow again.” Very scientific. Almost suitable for a dashboard title.
The missed signal, then, was not necessarily one absent alert inside GitHub. The public reports do not provide GitHub’s internal metrics or alert history. The missed signal for those of us reading the status page is the sequence itself: repeated trouble near write paths, queue entry, shared database capacity and processing backlogs over six days.
What happened across the six days
The October 7 report describes a recurrence of an earlier write-operation outage. GitHub observed widespread impact from 16:52 to 17:01 UTC across Actions, Git Operations, Issues and Pull Requests. The report says both outages shared the same root cause and that a durable mitigation was being prepared.
“All systems have recovered. We have applied mitigations and do not anticipate another recurrence.”
Five days later, at 11:51 UTC on October 12, GitHub began returning elevated HTTP 500 responses across several application pages. Issues, Pull Requests, Projects and Actions failed. Customers also saw delayed web and email notifications.
The immediate application impact was mitigated by 12:41 UTC, fifty minutes after the reported start. Notifications took much longer. They were recovering at 15:27 UTC and were fully mitigated at 20:16 UTC, after the system had worked through a backlog.
The technical explanation is unusually useful. A latent condition in the notification delivery pipeline generated a high volume of an expensive query against sharded database replicas. That consumed database capacity needed by Issues, Pull Requests, Projects and Actions.
At 12:33 UTC, GitHub listed possible trouble loading the Actions interface, using the Checks API and queueing new Actions runs. This was not described as a shortage of runners. It was shared database capacity being consumed elsewhere, with queue admission among the visible casualties.
On October 13, at around 20:42 UTC, an infrastructure failure delayed the display of workflow-run logs. GitHub said no logs were lost, workflows ran normally, and neither runs nor checks were delayed. The supplied report does not state how long the delay lasted.
That distinction matters. Execution was healthy while visibility lagged behind it. An operator looking only at delayed logs could suspect stuck work; an operator looking only at completed jobs could miss that users had temporarily lost the evidence they needed to understand those jobs.
Why the pattern is easy to miss
Technically, these reports do not establish a single root cause across all three dates. October 7 was a recurring write-operation fault. October 12 was an expensive-query condition that reduced database capacity. October 13 was an infrastructure failure in log processing.
Calling all of this one runner-capacity incident would go beyond the evidence. Calling it irrelevant because the root causes differ would also be poor operations. Separate faults can expose the same weak operational boundary: work being accepted, started, recorded or made visible later than expected.
The October 12 notification backlog makes that boundary particularly clear. The application impact was mitigated, yet delayed notifications continued for hours while accumulated work drained. Recovery of the front door did not mean recovery of the queue behind it.
The human reason is simpler. Status pages present incidents as individual records. Each gets a title, a timeline and eventually a resolved label. Once the label turns green, we are tempted to close the mental ticket as well.
That habit hides recurrence across components. A write outage on Wednesday, queueing trouble on Monday and delayed logs on Tuesday can land with different teams and different labels. The CI/CD user experiences one service that alternates between refusing work, delaying evidence and making progress difficult to judge.
I would treat the sequence as a reason to test a capacity-and-queue hypothesis, not as proof of one. The tests belong in our own monitoring. We do not need access to GitHub’s internal telemetry to learn from the shape of its incidents.
What would catch the same pattern in our runner pools
For a self-managed CI/CD environment, queue depth and job-start latency must be separate measurements. They describe related conditions, but they do not tell us the same thing.
A queue of twenty jobs may be harmless if runners start them quickly. A queue of two may be serious if both have waited far beyond the normal start time. One metric counts waiting work; the other measures the experience of each waiting job.
- Measure queue depth by runner class. Keep separate series for each runner pool, execution class or workload type. One combined count can hide a blocked specialist pool behind idle general-purpose capacity.
- Measure job-start latency as a distribution. Record the interval between queue admission and actual execution. Alert on sustained deterioration in the slower portion of jobs, not only on an average that smooths away the pain.
- Track the oldest queued job. A stable queue depth can conceal one item that never starts. Age exposes starvation and scheduling faults that a simple count misses.
- Separate execution health from visibility health. Monitor job runtime and completion independently from log-ingestion delay, check publication and status updates. A job can run normally while its evidence arrives late.
- Keep the alert open until the backlog drains. Returning the API or scheduler to service is only partial recovery when queued jobs, logs or notifications remain behind. Recovery needs a backlog-clear condition.
The October 12 report shows why the final check matters. Application functions recovered before notification delivery did. If the incident had been closed at the first sign of healthy requests, the remaining backlog would have become an invisible tail.
There is also a practical correlation rule worth adding. When write errors, queue depth, oldest-job age and job-start latency move together, create one operational view even if separate teams own the components. Do not force the person on duty to assemble the sequence from four tabs while a release waits politely in line.
On Monday, graph queue depth, oldest queued-job age and job-start latency separately for every runner pool.
Sources
- GitHub Status, “Incident with Git Operations, Issues, Actions and Pull Requests,” October 7, 2026: https://www.githubstatus.com/incidents/qpfv5p86dmrl
- GitHub Status, “Incident with Actions, Pull Requests and Issues,” October 12, 2026: https://www.githubstatus.com/incidents/93njd414rpbx
- GitHub Status, “[Retroactive] Actions workflow run logs delayed,” October 13, 2026: https://www.githubstatus.com/incidents/6yk962mhlr3h