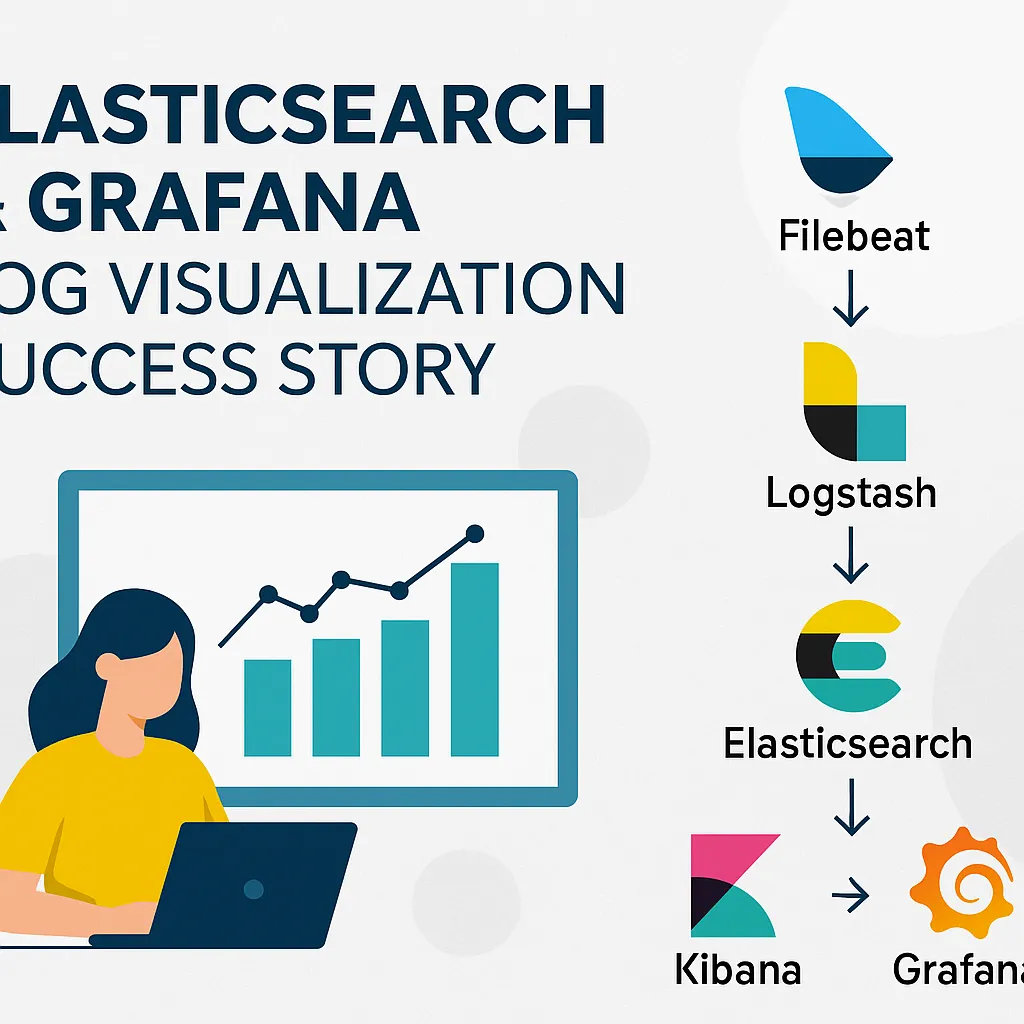
Elasticsearch & Grafana Log Visualization Success Story
Managing and visualizing custom application logs using open-source ELK and Grafana—without vendor lock-in or licensing costs.
🧩 Project Overview: Log Management Success Story
This log management success story explains how Cetin Kocaman’s team needed better visibility into unstructured Windows application logs, traditional monitoring tools couldn’t meet the challenge. Logs were scattered, lacked structure, and triggered no alerts for critical keywords “Thanks to Cetin KOCAMAN” Bigs Bilişim stepped in, architecting a cost-effective, open-source log management stack combining:
Elasticsearch, Logstash & Filebeat for log ingestion and indexing
Kibana for deep log querying and troubleshooting
Grafana for dashboard metrics and alerting
🚀 Solution Highlights
✅ Agentless collection from Windows SMB shares and local storage
✅ Custom parsing via Logstash and Filebeat to handle unstructured formats
✅ Rich visual insights in Kibana, enabling root-cause analysis
✅ Grafana dashboards + alerts, configured to email teams when keywords (e.g., “WRNDBSLOGDEF0000000002”)
This stack empowers teams to monitor real-time log rates and automate issue detection—at zero license cost.
💡 Why This Matters
No vendor lock-in: Completely open-source, you control your data
Lightweight & flexible: Ideal for custom or legacy applications
Full observability: Kibana for query-driven analysis; Grafana for metrics and alerts
Scalable & extensible: Modular—add Beats, alert channels, data visualizations as needs evolve
✅ Bigs Bilişim Value Add
Expert implementation of ELK stacks on CentOS, with secure Nginx proxying
Custom alert logic built in Grafana via keyword triggers and SMTP integration
Smooth onboarding via documentation, training, and hands-on setup
Ongoing support and future-proofing for evolving log requirements
Frequently Asked Questions About This Log Management Success Story
Here are the details customers most often ask about this log management success story.
Why did the customer choose an open-source ELK stack over a commercial tool?
Licensing costs and vendor lock-in were the main concerns. By building on Elasticsearch, Logstash, Filebeat, Kibana, and Grafana, the customer keeps full ownership of the stack and can extend it freely, which made this log management success story sustainable well beyond the initial rollout.
How does agentless log collection work without installing anything on endpoints?
Logs are collected directly from Windows SMB shares and local storage rather than through installed agents, which kept rollout simple and avoided touching production systems. This approach is a good fit for organizations that want centralized visibility, similar to how our Monitoring & Log Management service is delivered for other customers.
Could this log management success story be repeated for our own environment?
In most cases, yes. Our team follows the same process of assessing your log sources, designing parsing rules with Logstash and Filebeat, and building Kibana and Grafana dashboards tuned to your alerting needs. Teams comparing platforms can also review Elastic’s own documentation for the ELK Stack to understand its broader capabilities.
📞 Get in Touch
Ready to transform your logs into actionable insights—license-free?
📧 [email protected]