Turn Monitoring Alerts Into Automated Operational Action
Traditional monitoring tools are good at generating alerts.
They are not good at managing them.
Most IT teams still rely on human operators to review alerts, understand the issue, decide whether it is real or noise, take the first action, and escalate when needed. This creates delay, inconsistency, operational cost, and alert fatigue.
Our AI-Driven Monitoring Operations Platform changes that model.
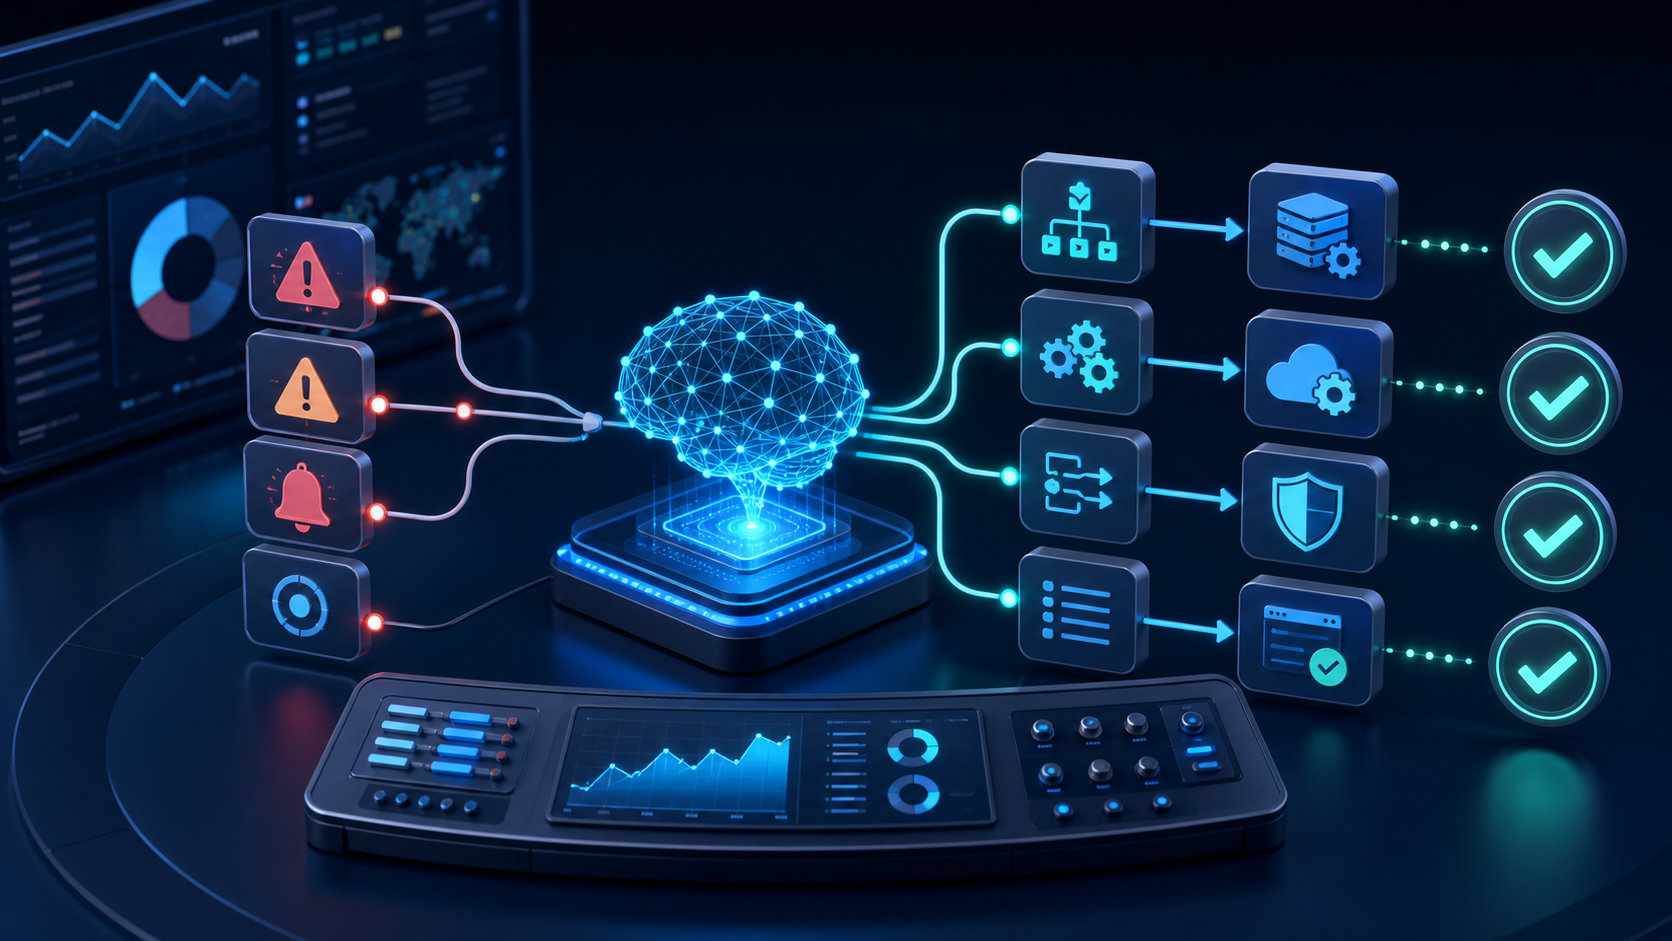
It adds an AI-assisted operational layer on top of your monitoring environment and transforms alerts into structured decisions, automated first-response actions, remediation workflows, and clear escalation summaries.
Instead of only telling you that something is wrong, the platform helps you decide what it means, what should happen next, and whether it can be resolved automatically.
What This Platform Does
The platform receives monitoring alerts from systems such as Zabbix, analyzes the alert context, classifies the event, and routes it through predefined operational workflows.
Depending on the incident type and confidence level, it can:
-
identify whether the alert is likely noise or a real incident
-
determine the probable cause
-
select the correct runbook
-
decide whether the action can be executed automatically
-
perform standard remediation steps
-
validate the result after action
-
notify an administrator when human review is required
-
keep a structured operational record for reporting and dashboarding
This allows organizations to move from passive monitoring to AI-assisted Level-1 operations.
Core Capabilities
Intelligent Alert Triage
Every incoming alert is analyzed and categorized before action is taken. The system can distinguish between routine, repetitive, actionable, and high-risk incidents.
Automated Runbook Execution
When the incident matches a trusted and safe remediation pattern, the platform can trigger a predefined runbook automatically.
Examples include:
-
restarting stopped services
-
checking CPU, memory, or disk usage
-
validating agent status
-
performing post-remediation verification
-
collecting diagnostic output for escalation
Human-Safe Decision Logic
Not every alert should be automated.
The platform supports rule-based safety controls such as:
-
forcing manual action for repeated incidents
-
notifying administrators for risky or recurring patterns
-
blocking automation for low-confidence events
-
escalating when remediation fails or verification does not pass
Operational Visibility
All actions, decisions, outcomes, and summaries are recorded and visualized through dashboards.
This gives you visibility into:
-
total alerts handled
-
successful auto-remediations
-
failed or unresolved incidents
-
incidents requiring admin attention
-
top recurring hosts and trigger types
-
runbook success rates over time
Multi-Environment Support
The platform is designed to support both Windows and Linux operational workflows, making it suitable for mixed enterprise environments.
Why Traditional Monitoring Is Not Enough
Monitoring tools generate information.
Operations teams need decisions.
In many environments, the real cost is not alert generation. The real cost is:
-
too many repetitive alarms
-
manual Level-1 workload
-
inconsistent first response
-
slow escalation
-
limited reporting on operational effort
-
difficulty proving service value to customers
This platform fills that gap.
It introduces a new operational model where monitoring alerts are no longer just notifications. They become structured operational events that can be analyzed, acted on, tracked, and measured.
Typical Use Cases
Our AI-Driven Monitoring Operations Platform is especially valuable for:
Managed Service Providers
Reduce repetitive L1 effort and provide customers with measurable operational outcomes.
Internal IT Operations Teams
Standardize first-response actions and reduce dependency on individual operator experience.
NOC / Monitoring Teams
Lower alert fatigue and improve response consistency across recurring incidents.
Hybrid Infrastructure Environments
Manage alerts across Windows, Linux, and mixed service stacks using a unified decision model.
Example Incident Flows
The platform can support operational scenarios such as:
-
monitoring agent unavailable
-
service stopped unexpectedly
-
high CPU usage
-
high memory consumption
-
low disk space
-
repeated alert patterns within defined time windows
-
incidents requiring safe escalation with summary context
For each scenario, the platform can combine AI classification, runbook selection, execution control, and post-check validation.
Business Value
Reduce Manual Operational Load
Automate repetitive first-line actions and let human teams focus on exceptions and higher-value work.
Improve Response Time
Move from delayed manual review to immediate AI-assisted triage and action.
Increase Consistency
Apply the same logic, same runbooks, and same validation process every time.
Reduce Alert Fatigue
Separate noise from real incidents and avoid unnecessary operator involvement.
Create Measurable Service Reporting
Show how many alerts were handled, how many were resolved automatically, and where admin attention was required.
Build a Scalable L1 Operations Model
As your infrastructure grows, the platform scales operational decision-making without scaling headcount at the same rate.
Platform Approach
Our approach is not “AI without control.”
This platform is built around controlled automation.
That means:
-
predefined and approved runbooks
-
clear decision boundaries
-
post-action verification
-
manual fallback paths
-
escalation for repeated or risky incidents
-
dashboards and operational traceability
The result is a practical model for organizations that want to introduce AI into operations without losing governance.
Designed for Real Operations
This is not a theoretical AI demo.
The platform is designed for real-world operational environments where reliability, auditability, and controlled action matter.
It combines:
-
monitoring integration
-
workflow automation
-
AI-based incident reasoning
-
remediation logic
-
verification steps
-
dashboard reporting
-
admin notification and escalation paths
This makes it suitable for organizations that want to evolve from classic monitoring into AI-assisted operations.
A New Service Model: AI-Assisted L1 Operations
We believe the next step after monitoring is not just better dashboards.
It is AI-assisted operational execution.
With this platform, organizations can move toward a service model where:
-
alerts are triaged automatically
-
routine incidents are handled faster
-
operators receive cleaner and more meaningful escalations
-
operations become more measurable and scalable
This creates the foundation for a modern AI-assisted L1 Operations Service.
Let’s Build Your Operational Automation Layer
If your team is overwhelmed by repetitive monitoring alarms, manual first-response work, and limited visibility into operational effort, this platform can help.
We can adapt the solution to your environment, workflows, escalation rules, and remediation standards.
Contact us to discuss how AI-assisted monitoring operations can reduce operational load and improve service response quality in your infrastructure.
Frequently Asked Questions
What is AI-Assisted Monitoring Operations?
AI-Assisted Monitoring Operations is an operational layer that works on top of existing monitoring tools. It helps classify alerts, select the right runbook, execute approved first-response actions, validate the result, and escalate incidents when human attention is required.
How is this different from traditional monitoring?
Traditional monitoring tools mainly generate alerts and notifications. AI-Assisted Monitoring Operations goes further by helping teams understand the alert, decide what should happen next, trigger controlled remediation workflows, and record the operational outcome.
Does this platform replace Zabbix or other monitoring tools?
No. The platform does not replace existing monitoring tools. It works as an additional operations layer on top of tools such as Zabbix, Grafana, Prometheus, ELK, Loki, or other alert sources.
Can the platform automatically resolve incidents?
Yes, but only for approved and clearly defined scenarios. For example, it can restart known services, check disk usage, validate monitoring agents, collect diagnostic data, or run predefined remediation steps when the incident matches a trusted runbook.
Is every alert handled automatically?
No. The platform is designed around controlled automation. Risky, repeated, unclear, or low-confidence alerts can be marked for manual review and escalated to administrators with a structured summary.
What types of incidents can be handled?
Common scenarios include monitoring agent failures, stopped services, high CPU usage, high memory consumption, low disk space, repeated alert patterns, and incidents that require structured escalation with diagnostic context.
Does the platform support Windows and Linux systems?
Yes. The platform is designed for mixed Windows and Linux environments. It can support operational workflows using PowerShell, Bash, monitoring APIs, SSH, service checks, log checks, and approved automation workflows.
How does the platform decide whether an action is safe?
Actions are controlled through predefined runbooks, incident rules, confidence levels, repeat-count thresholds, verification steps, and escalation policies. The system can block automation when the incident is risky, unclear, or recurring too often.
What is a runbook in this platform?
A runbook is a predefined operational procedure for a specific incident type. It defines what should be checked, which action can be executed, how the result should be validated, and when the incident must be escalated.
Can this reduce alert fatigue?
Yes. The platform helps reduce alert fatigue by filtering noise, identifying repeated patterns, grouping operational events, and allowing operators to focus on incidents that actually require human judgment.
Does the platform provide dashboards and reporting?
Yes. It can provide visibility into total alerts handled, successful auto-remediations, failed actions, unresolved incidents, repeated hosts, top trigger types, runbook success rates, and incidents requiring administrator attention.
Who should use AI-Assisted Monitoring Operations?
This solution is suitable for managed service providers, internal IT operations teams, NOC teams, and organizations with repetitive Level-1 monitoring workload across cloud, on-premise, or hybrid infrastructure.
Can this be used as a managed service?
Yes. Bigs Bilişim can deliver AI-Assisted Monitoring Operations as a managed service, including assessment, runbook design, integration, workflow implementation, dashboarding, reporting, and ongoing operational tuning.
How do we start?
The usual starting point is an assessment or pilot project. Bigs Bilişim reviews your current monitoring environment, recurring alerts, operational pain points, and support processes, then defines a controlled pilot scope with measurable outcomes.
How Every Alert Is Processed
Every alert coming from Zabbix passes through an AI-driven decision engine: the alert’s history is checked (Operational Memory), a risk score is calculated (RCI), and the appropriate runbook is either executed automatically or submitted for human approval. The result: no one needs to sit and watch screens during the night shift; your team only handles the exceptions that truly require a human decision.
12 Capabilities
- AI Alert Analysis & Triage — Every alert is classified: is it a real incident, noise, or a recurring issue?
- Automated Remediation — Runbooks such as agent restarts, disk cleanup, or service restarts run automatically through security gates.
- Expected Events (Planned Event Awareness) — Planned maintenance and scheduled reboot windows are known in advance, so no false alarms are generated.
- Reboot Forensics — For unplanned restarts, the root cause is automatically investigated: was it planned, a cron job, kernel/OOM, or a power outage?
- Post-Remediation Verification — 15 minutes after every automated action, the system verifies its own work; if the fix didn’t hold, it escalates.
- Human-in-the-Loop Approval — High-risk actions are sent to Telegram: Approve & Run / Acknowledge / Snooze — with a single tap.
- Alert Storm Protection — When multiple hosts fail at once (switch, hypervisor), automation is paused and a single, consolidated root-cause analysis is produced.
- Capacity Forecasting — Disk and memory trends are projected (“full in X days”); you’re warned before the alarm ever fires.
- Two-Way Monitoring (Sweep) — The platform also queries Zabbix directly, catching alerts that slipped through the webhook pipeline and hosts that have become unreachable.
- Dead Man’s Switch — The monitoring automation itself is monitored; if the platform ever goes down, you’re notified through an independent channel.
- Shift & Hygiene Reports — An AI-written shift handover report every morning; alert-noise-reduction recommendations every week.
- Self-Backup — The entire automation configuration is automatically backed up at regular intervals.
Security Model — Bigs AI Governance Framework
The AI never operates with unlimited authority. Every action is scored using the RCI (Remediation Confidence Index): Predictability, Reversibility, Blast Radius, Historical Success, and Detection Confidence. Low-risk actions run fully automatically, medium-risk actions require human approval, and high-risk actions are always handled manually. Recurring alerts (3+ within 6 hours, 5+ within 24 hours) and disaster-level incidents are automatically escalated to human control. For the detailed methodology, see our Bigs AI Governance Framework whitepaper.
Why Now?
- Alert fatigue: L1 teams know that 90% of the hundreds of daily alerts are noise, yet they still have to check every one of them.
- The cost of 24/7 shifts and a shortage of staff: staffing a qualified L1 night shift is both expensive and unsustainable.
- MTTR and SLA pressure: response within minutes doesn’t scale with human reaction speed.
Who Is This For?
Businesses running their own data center, hosting/MSP providers, teams operating SAP and enterprise application infrastructure, and organizations that want to protect their existing Zabbix investment.
How Do We Get Started?
- Discovery & RCI workshop — your existing alert inventory and runbooks are scored.
- Pilot — starts with read-only plus low-risk automation on selected systems.
- Expansion — scope is grown as it’s proven out with automated verification data.